
We won’t waste any time. You can refer to these levels going forward for some major charts I (we) all watch. Starting with the one everyone talks about:
A. Dow Jones Industrial Average
A couple of things I am watching: Taking into account the major uptrend which started back in 2008, to all-time highs, we have retraced 38.2% of that move, or a bit more as of the close today. The markets respect these Fibonacci levels. It appears the DJX breached the 38.2% level as of today, but it is very rare to break these levels in one swoop. Normally it will bounce on it a time or two before giving away. Also, I have a broadening pattern drawn. Often you will see a bounce near the bottom trend line of these broadening patterns. Finally, the RSI index has not been this OS on a weekly basis since the financial crisis. For this reason, I think in the next day or two you will see a fairly swift bounce in this particular index. It will likely be short-lived, and we will proceed down to the 50% retracement level near Dow 18,500.

B. Russell Small Caps IWM
The risk on index leads us lower as it generally does. It has retraced 50% of its move over the past decade. Next target to the downside would be the 2016 lows and then the 61.8% retracement about 20% lower. Before that happens I expect a bounce as the RSI hasn’t been this oversold in the 2000s.

C. QQQ NASDAQ
The fearless market leader for so long has still held its trend for now. I would expect before this is said and done for it to retest lower, somewhere between the 2018 lows and the .38% retracement from 2009 to the all-time high.

D. HYG
HYG is a credit proxy. I won’t get into it for the sake of this post but in times of financial distress you will hear the financial media speaking of credit markets. I used my crayon to be “generous” on the chart below. Thus far the media has said we aren’t anywhere near the credit mess we were in back in 2008. I would say that this chart shows we aren’t yet but we are close. We want to see this firm up. I’ll leave it at that.

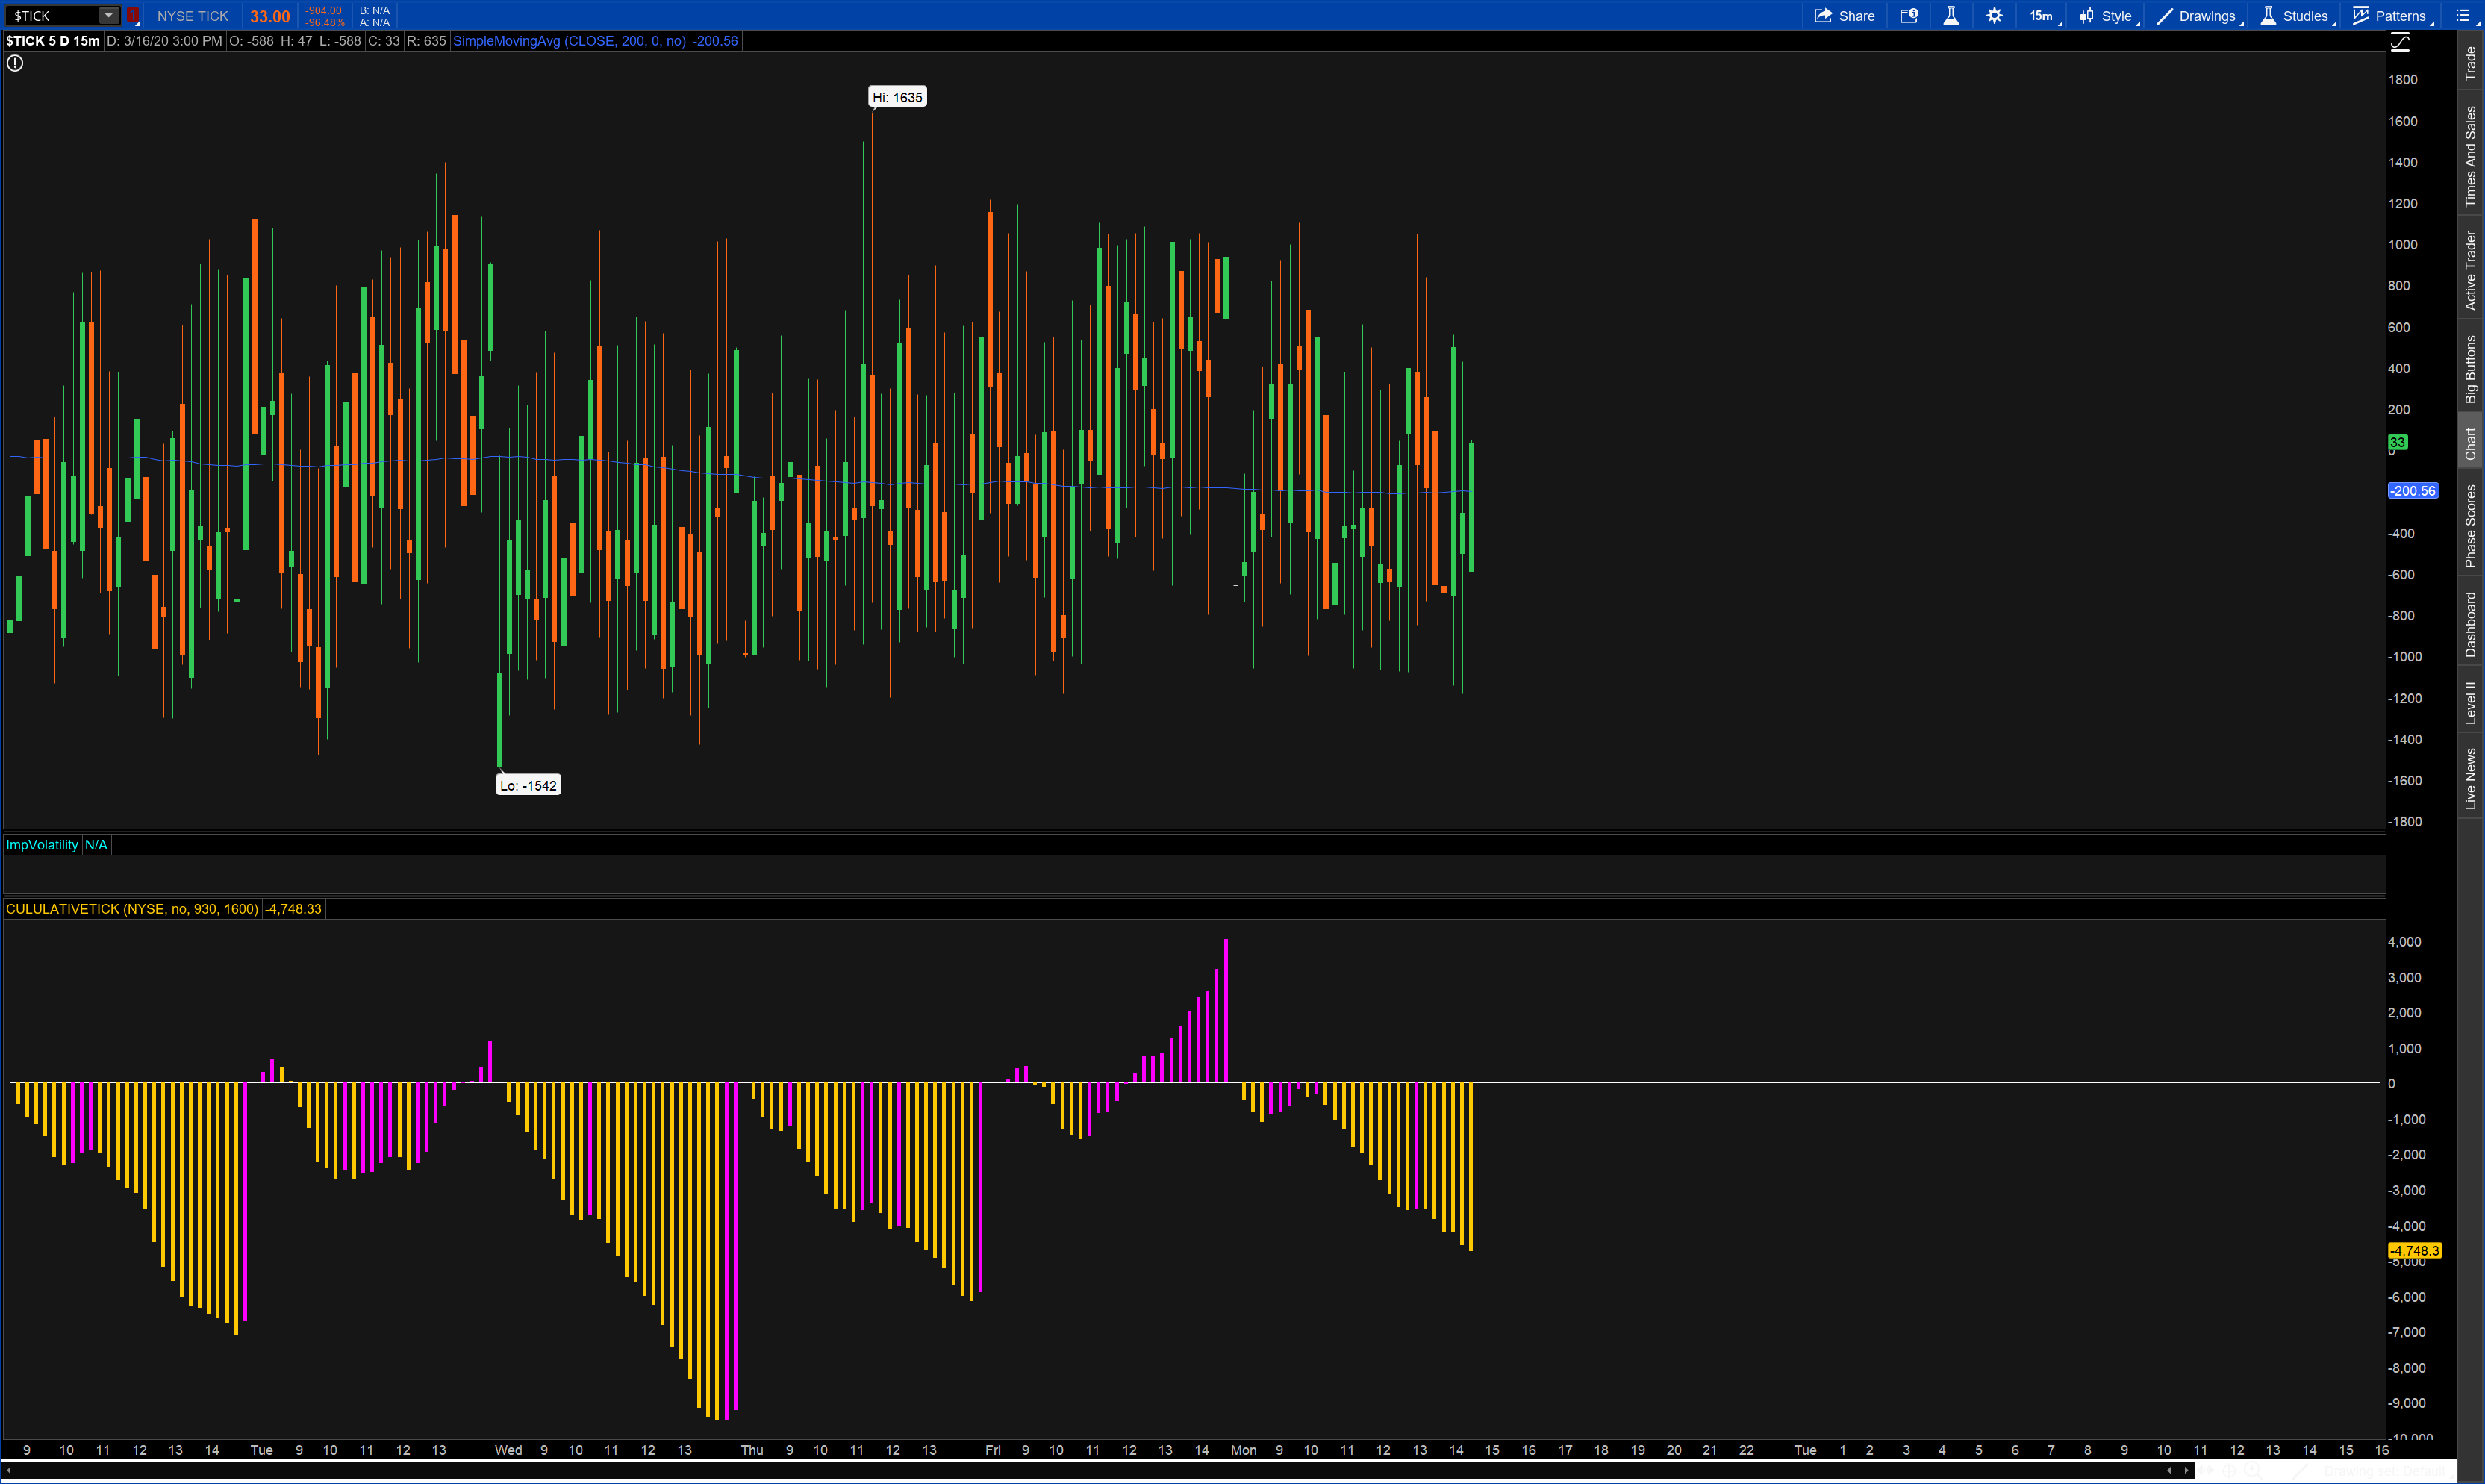
For now I want to leave on a positive note. An indicator that I watch which gauges the strength of buying and selling pressure across a big group of NYSE traded stocks. Above the 0 line shows buying strength and below selling. You’ll read headlines about it being the worst loss ever point wise this evening. But take a look – the selling pressure was not on par with what we saw last week. A sign that selling pressure may be tiring and a near term bounce is around the corner.
E. NYSE CUM TICK
All week I’ll be posting bits and pieces to try and keep you guys educated and give you a perspective you won’t get from a headline.
Stay healthy.
Trent J. Smalley, CMT