
Good afternoon and congratulations for making it through an extremely difficult year. Whether you were directly affected by COVID-19 or felt its effects indirectly, Ryan and I want to take a moment to recognize those going through immense hardships this year.
Lives were lost, jobs were lost, loved ones were lost, businesses were lost, and sanity was lost. The good news is there is light at the end of the tunnel with multiple vaccines, much needed government stimulus, and a coordinated global effort to resume life as it once was. No matter what the media spews, I choose to believe the best days, as always, lie ahead.
I became a fully registered IAR (Investment Advisor Representative) and portfolio manager for JSPM LLC this year. I’ve been a trader and investor since 2007, but 2020 was the year I chose to manage other families’ financial livelihoods for a fee. Uncanny timing.
I’ve previously mentioned that I didn’t come into this business as many others do. I wasn’t employed by a broker dealer, never went door to door trying to sell insurance or annuities, and have yet in my life to make a single cold call. I started as a trader, and I have to credit my success today to all the trials and tribulations that every single individual who calls himself or herself a “trader” experiences.
Every last market lesson that I have scribbled in any one of my 14 annual trading journals was put to the test in 2020. My portfolio management principles devised over the past decade plus bent, but didn’t break. Of course there are things I feel I could have done better, but hindsight is 20/20 and I believe that our clients will be happy with our results.
The following statistics serve to show, in plain speak, how the JSPM-Omaha Growth Strategy performed since its inception on July 27th, 2020. Current and prospective clients should refer to this to gain an understanding of how we measure ourselves versus industry benchmarks. What follows is not a victory lap. It is a graphical depiction of how this particular model is managed. Active management may not be right for all clients, and we run other strategies as well. Clients invested in this particular strategy have demonstrated the appropriate risk tolerance and have been found suitable for this style of investing. The following is not a hypothetical, it is the account of a client who started with a round number of near $150,000 as of July 27th. The account number has of course been omitted.
Net Asset Value & Cumulative Return
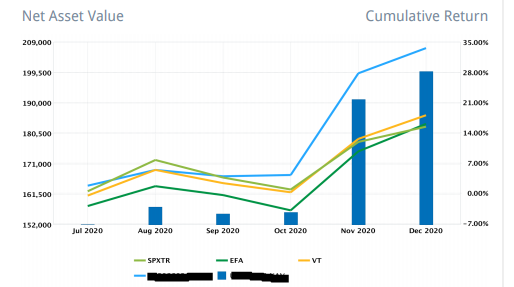
Color key as follows:
SPXTR (Light Green): S&P 500 Total Return Index
EFA (Dark Green): Index of Developed Market Securities in Europe, Asia, and Far East
VT (Yellow): Vanguard Total World Stock Index
JSPM-Omaha Growth Model (Blue)
Graphically, you can see that the JSPM Omaha Growth Strategy (will refer to going forward as “The Strat”) kept pace with and slightly outperformed the other indexes throughout the summer. It outperformed fairly drastically beginning in October and rounded out the year in strong fashion. Cumulative Return numbers from July through year end came in at nearly 34% as the other indexes returned between 15 and 18%.
Another way to view this via bar and line charts:
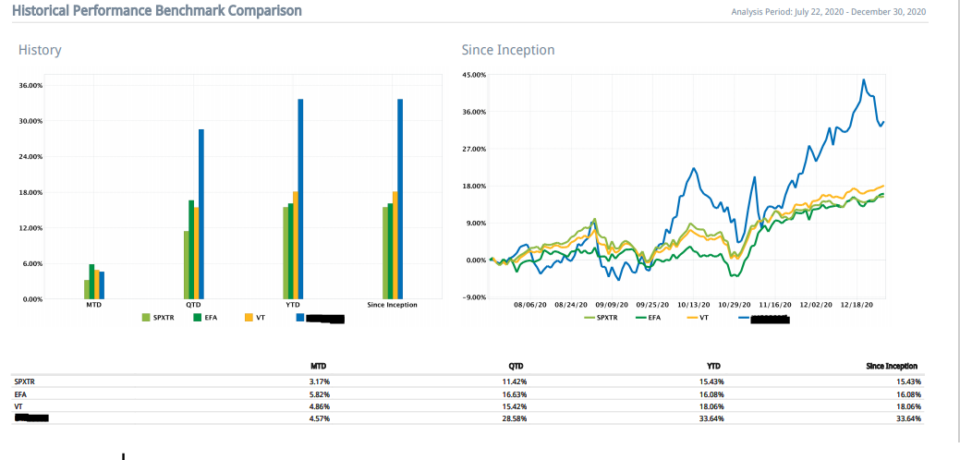
Remembering that “The Strat” is in blue, one may look at this and see outperformance relative to the benchmarks. This is what clients that are a part of this strategy pay us for. What you should also notice are the “squiggles.” Notice how this strategy “moves around more.” In our industry this “moves around more” is known as volatility. With high growth securities being the bulk of the portfolio, this is to be expected. With higher risk can come higher reward, but not always. For the time period in question, this higher risk investing indeed lead to greater returns.
Sector Allocation
A major tenant of investing performance is being allocated to the strongest sectors in the market. You have likely heard of the term “diversification” when it comes to investing. Diversification is the practice of spreading your investments around so that your exposure to any one type of asset is limited. This practice is designed to help reduce the volatility of your portfolio over time. This particular strategy tries to do almost the opposite. We want to “overweight” to the areas of the market that are performing the best and “underweight” to those not performing as well. All this means is that we allocate more money to the areas currently outperforming and less to those that are not. The blend as the portfolio stands today:
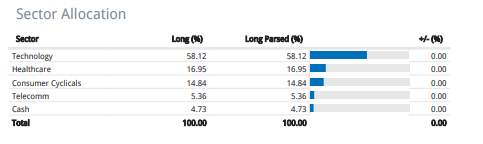
Technology remains overweight as we head into 2021. This can and will likely change as other areas of the market such as energy, cyclicals, and industrials/materials look to play catch up with the reopening of the economy in the new year. While technology will lead to outsized returns in the future, I don’t believe it will be the only game in town in the coming year. We will see.
Benchmark Performance Comparisons (Month by Month since Inception)
This view serves to show how this strategy performed month by month. A month is far too short of a snapshot in time when benchmarking performance. Even a single quarter doesn’t and shouldn’t depict relevant performance numbers. However, I feel the following will serve well to show how different styles drift in and out of fashion so I wanted to include it.
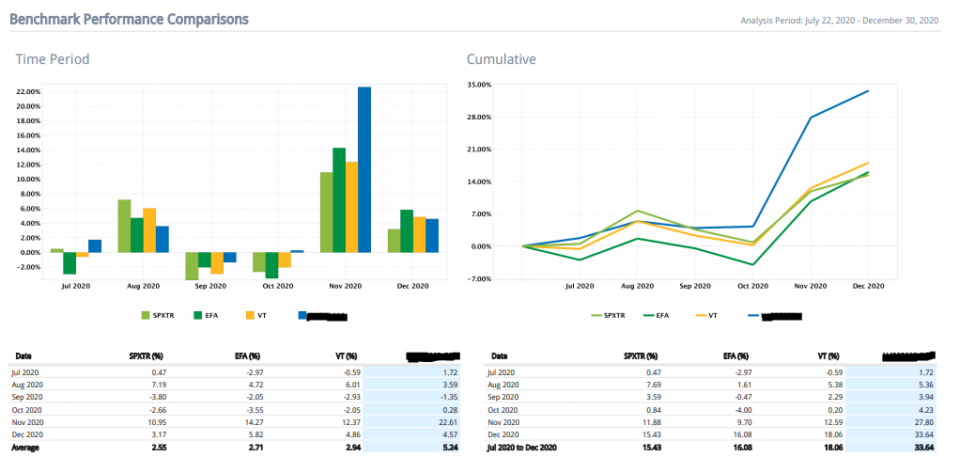
High growth investing is subject to “fits and starts.” When I began managing money this way years ago, it was a true test of patience on one hand, and on the other, managing bursts of euphoria. While other styles are slow and steady, this style of investing goes in bursts. Often you will make a bunch of money in short bursts, and then you’ll sit for a couple of months while things cool off a bit. At the end of a significant period of time, this style can lead to outsized returns and it has, but you can see a two month period where high growth names underperformed. In fact, I blogged about this just before it happened here:
“Short Term Caution Warranted”
Appetites for risk goes in cycles and this investing style comes with periods of waiting for risk appetites to emerge. If you aren’t a person of patience, or you get scared off easily by bouts of higher volatility this type of investing likely isn’t right for you. It rewards those with perspective and an understanding that owning the very best of companies will still lose you money sometimes. If you understand this and are able to manage expectations, you’ll be handsomely rewarded in time.
Value Added Monthly Index & Benchmark Comparison
Value Added Monthly Index or VAMI is my favorite part of each of these portfolio updates. Why? VAMI shows the real value we bring to client portfolios. In short, what are you paying me for with respect to your investment portfolio’s performance? Am I doing what you are paying me for? At JSPM LLC we charge a fixed fee to manage portfolios. The actively managed models charge a premium and we strive for outperformance. VAMI is calculated using NET monthly returns. This means that any applicable fees, such as management, incentive, and brokerage fees, have already been deducted and what’s left is the real return. What YOU made on a hypothetical $1000 invested with us after we paid ourselves.
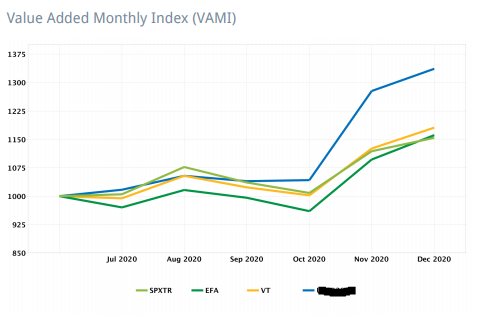
As you can see, for the time period in question and all starting with $1000, the JSPM-Omaha Strategy returned approximately $350 for every $1000 invested. The other indexes returned approximately $150-175 for every $1000 invested. If this style of investing was right for you, you were rewarded with outperformance in the second half of 2020 relative to the benchmarks.
Risk Analysis
Finally, no portfolio performance review is complete without a quick rundown of how it performed on a risk adjusted basis. This is really important to me and something I focus a lot of time and effort on so I want to go into a bit more detail here…
When you are managing your own money or you are a trader, you are free to do whatever you want. By this I mean, you aren’t subjected to any real performance metrics or industry standards with respect to your performance. All the financial gurus and those participating in “Investing Championships” (I mean…. really?) can parade around and boast about 300% returns in a years’ time. Some people have such performance undeniably, but how was it achieved?
You could have put your entire portfolio in Tesla stock would have been one way to do it. (you’d be up almost 600% YTD)
Twilio call options.
Fastly LEAPS.
Pinterest stock, all in bro.
I’m not jealous, I came from that world and still participate with a small portion of my available funds. Want proof?

That is one of my long dated Pinterest call options I bought when the world was falling apart this past spring. It’s up a cool 748% and doesn’t expire for over year.
The game changes when managing money for real. I have to make certain my risk adjusted returns are within the realm of a professionally managed portfolio. “YOLOing” client retirement money isn’t a thing, nor is putting it all in 3 biotech lottery ticket style stocks. That is gambling, and has no place in managing real money. If someone is telling you they have 200% returns year after year, why aren’t they being paid millions as a hedge fund manager? That type of alpha will get you paid extremely handsomely. My best guess is they are selling a subscription stock pick service or financial letters. These are two very different worlds, one real investment managers don’t participate in.
That being said, here are the risk analysis numbers I promised:
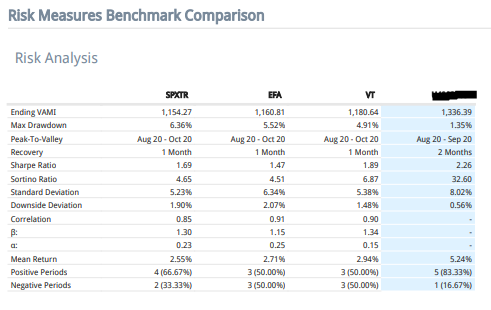
VAMI we already went over. Max Drawdown is important as it shows how strict an investment manager’s risk management is. The three most important numbers included are the mean return Sharpe and Sortino Ratios. (Sortino will need to be rerun as these values are off)
Sharpe is an industry benchmark for risk adjusted return. In short, if you are taking on additional risk in the form of a higher allocation to a certain area of the market (less diversification) or holding a greater number of stocks with higher than normal volatility, you should be capturing greater return as well. You generally don’t want the Sharpe Ratio to fall under 1.0, especially if you charge an active management premium. Anything above 1 is considered good, and above 2.0 is really good, reserving 3.0 or higher for extreme outperformance on a risk adjusted basis. I am satisfied with 2.26 especially in 2020.
In sum, the portfolio has performed well in its short lifespan. In no way does past performance guarantee future results. The year to come will bring its very own surprises and we will continue to do our very best to see to it that our clients are well positioned to take part in market strength. We will focus even harder on conserving the hard earned gains achieved in 2020. Further blogs and commentary will follow in the coming days and weeks as the market begins to show its hand in the early going in 2021.
We at JSPM wish you all a safe and happy beginning to 2021 and we look forward to hearing from you in the new year.
Trent J. Smalley, CMT (Portfolio Manager, JSPM-Omaha Growth Strategy)
Want to invest with us? Send us a note! (MyPortfolioFix)