Futures opened this evening and the /ES was limit down in minutes. This used to be a rare occurrence of course, but in the new world it’s commonplace.
I want to talk about confluence. One of the most powerful tenets of technical analysis as a discipline. The concept is straightforward: Instead of relying on a single method of analysis, take several into account and pay special attention to price levels should they converge. In certain cases I layer in fundamental analysis as well, but being that the fundamentals of the market and individual companies have become particularly cloudy, we will ignore them for now.
Tonight we will take into account the major benchmark U.S. equity index, the S&P 500.
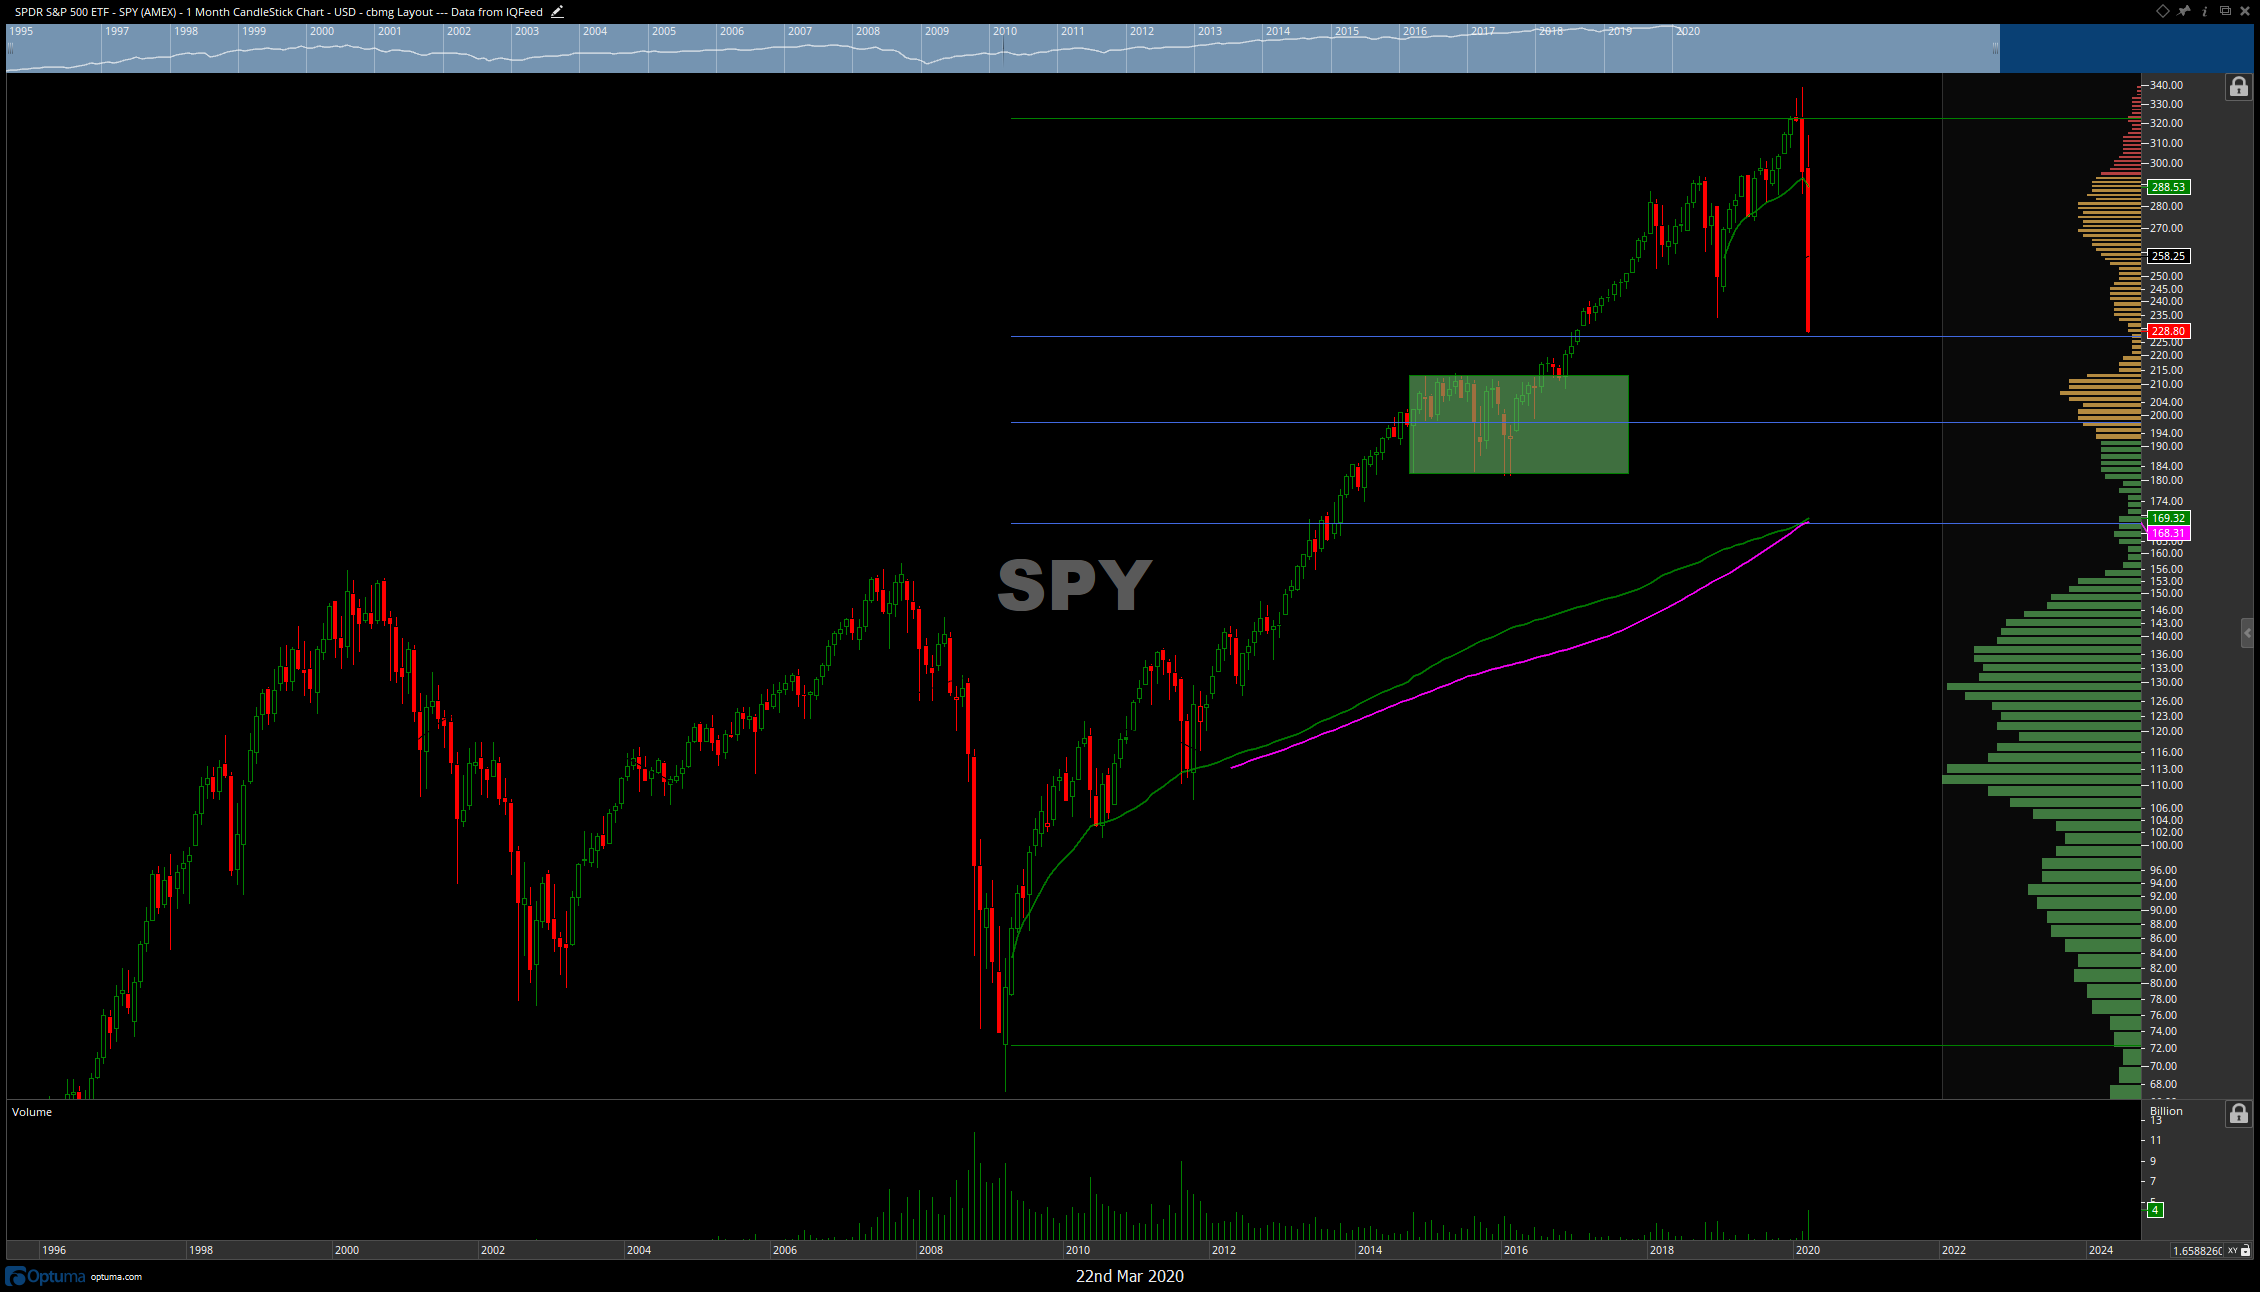
The chart below courtesty of my friends at Optuma shows several technical tools at work in one chart. It just so happens there is an area where a few of these converge, this is called an area of confluence. We will term this the value area.

This chart takes into account 25 years of price history and shows monthly price bars. Let’s start first with the blue horizontal lines. These are retracements from what the media calls “the longest bull market in history” which lasted from 2009 and ended just recently. The above chart shows that price as it stands as of the close of Friday is resting on the 38.2% retracement level. This will almost certainly be broken, giving way to the 2nd blue horizontal line which is the 50% retracement, this, is give or take SPY 200. It is common for price to retrace 50% in bear markets so from that standpoint nothing is out of the ordinary. What is extraordinary, however, is of course the velocity at which this has occurred. There has never been faster destruction of capital to date.
The green rectangle in the chart above shows a level of price acceptance of the consolidation range. For two years in the S&P Index price traded in a range, back and forth and fair value was agreed upon somewhere within that rectangle’s boundaries. These consolidation areas act as a cushion to falling prices. The rectangle is split down the middle by the 50% retracement level mentioned previously. Price has memory and it will likely spend some quality time revisiting its old stomping grounds from 2014-2016.
Finally, we see in this chart two converging lines. The green is the anchored volume weighted average price (AVWAP) developed by someone whom I have had the pleasure of meeting, Brian Shannon, CMT. This powerful study builds upon the general VWAP by allowing us to anchor the study at an area of importance, ours being the low in 2009 in this case. The pink line running alongside it is the 200 period simple moving average of price. Both of these are technical tools watched by institutions managing vast sums of investor capital. Both levels will elicit a response from buyers. How strong is yet to be seen, but you can be sure it will be a responsive area.
The price range on SPY: $180-210. Fibonacci retracements, past levels of price acceptance, moving averages of price, and AVWAP converging.
Value area.
Confluence.
More of these to come in the coming days.
Stay healthy friends.
Trent J. Smalley, CMT
